
Understanding Climate Solutions

In her Substack, We Can Fix It, Dr. Kimberly Nicholas identifies three more roles we can take advantage of to make a difference in reducing environmental impacts – role model, worker or student, and citizen. (See my last two blog posts for discussion of the first two roles.) But before I do a deep dive into the next role, I simply must take a detour. You see, this week I attended a webinar that blew my socks off – it was about Project Drawdown’s amazing tool called “Drawdown Explorer.”
First, a little background on Project Drawdown. Project Drawdown was envisioned by businessman and author Paul Hawken in 2001 and initiated by him in 2013 to bring together scholars, scientists, and researchers to map, measure, and model the one hundred most substantive solutions to address climate change. “Drawdown” is defined as “that point in time when the concentration of greenhouse gases in the atmosphere begins to decline on a year-to-year basis.” The group’s mission is to advance climate solutions and strategies based on rigorous science in order to reach the drawdown point before 2050.

Project Drawdown’s scientists have been at it ever since, and one result of their efforts is the amazing Drawdown Explorer. This user-friendly tool was launched in September of 2025 as an overhaul to their previous data sharing system, and it provides easy access to their findings and recommendations. Each possible solution is evaluated not only for its greenhouse gas reduction potential, but also for its feasibility, state of development, speed of implementation, cost, additional benefits, and negative impacts. These factors lead to the solution’s placement in one of four categories: Highly Recommended, Worthwhile, Keep Watching, or Not Recommended. There are no individual rankings of solutions since there is no clear metric by which they could be compared and almost all of them will have to be implemented at some point to address climate change. Project Drawdown provides their research information to help individuals, businesses, communities, and governments decide what climate actions are currently most important to them and most applicable in their situations.
You can imagine how extensive the Project Drawdown database is. Presenting that much data in a digestible format may seem like an insurmountable challenge, but they’ve done it. The basic information can be viewed as colorful cards, as a downloadable spreadsheet, or as a list indicating GHG Impact, with all formats including links to additional details. Each format can be filtered and sorted multiple ways or randomly shuffled to expose solutions you may not have considered.
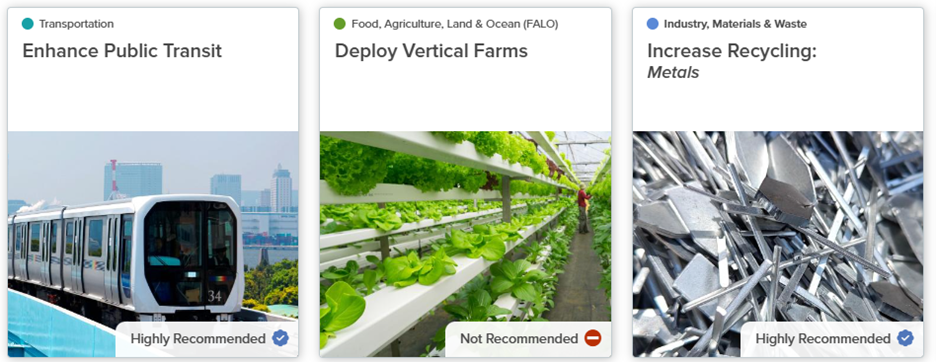
Front of cards
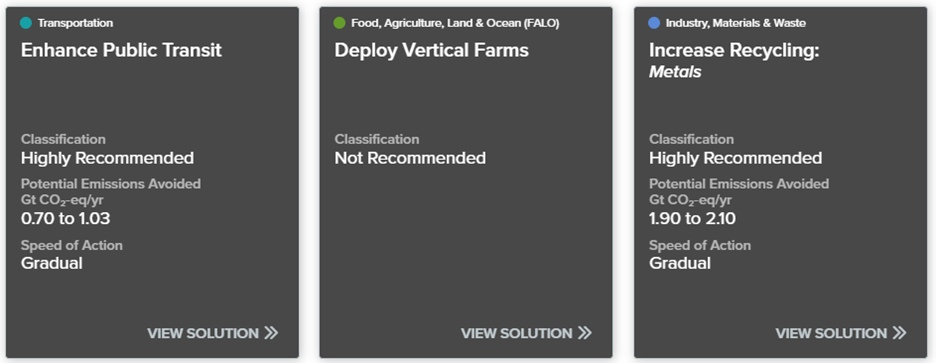
Back of cards
Above, you can see what a few of the solution “cards” look like. For the detailed analysis, you just click on “view solution.” Looking at these cards, I was curious why deployment of vertical farms is not a recommended solution, so I clicked the link on that card. What I learned is that “Vertical farms use enormous amounts of energy and material to grow a limited array of food, all at significant cost.” They go on to state that vertical farms may have some value for climate resilience and adaptation. But at this point, the emissions from materials and energy required to create vertical farms make this option a non-starter.
The Drawdown Explorer is a live system, a work in progress. Some solutions are still being evaluated and are noted as “Coming Soon.” As additional data becomes available, the Project Drawdown team will continue to update the system. I encourage you to check out the Drawdown Explorer and the rest of the website – it includes a video series, stories of climate heroes, commentary on hot topics, “Job Function Action Guides,” and so much more. I also encourage you to share it with friends and donate to support this important work, if you can [they’re a 501(c)3].
We’re all in this together, and Project Drawdown is here to help us all.