
Tell Me Something I Don’t Know
Image credit: NOAA
Sharing stories about people making a difference for the natural world is truly a joy. All the people I’ve covered recently are so interesting, and learning about them gives me hope in a world where hope is sometimes hard to find. These trail blazers are truly inspirational.
But I wouldn’t feel so compelled to do this if I didn’t know how much trouble we are in. Maybe that’s something I shouldn’t talk about – the experts say you can’t scare people into taking action. So I try to stay positive and action-oriented. But maybe some people don’t understand just how urgent this crisis is. So once in a while I’ll try to share some facts about the situation we are in.
You may have heard that on September 2 the UN released a report stating that the Earth is going to exceed the safe temperature threshold set during the 2015 Paris Climate Accord of 1.5º C above pre-industrial times. My reaction - “Gee, tell me something I don’t know.” Those who follow what’s happening with the climate have seen this coming for quite a while. Here is a graph showing average temperatures from 1970 through early 2025, including data from five reputable sources.
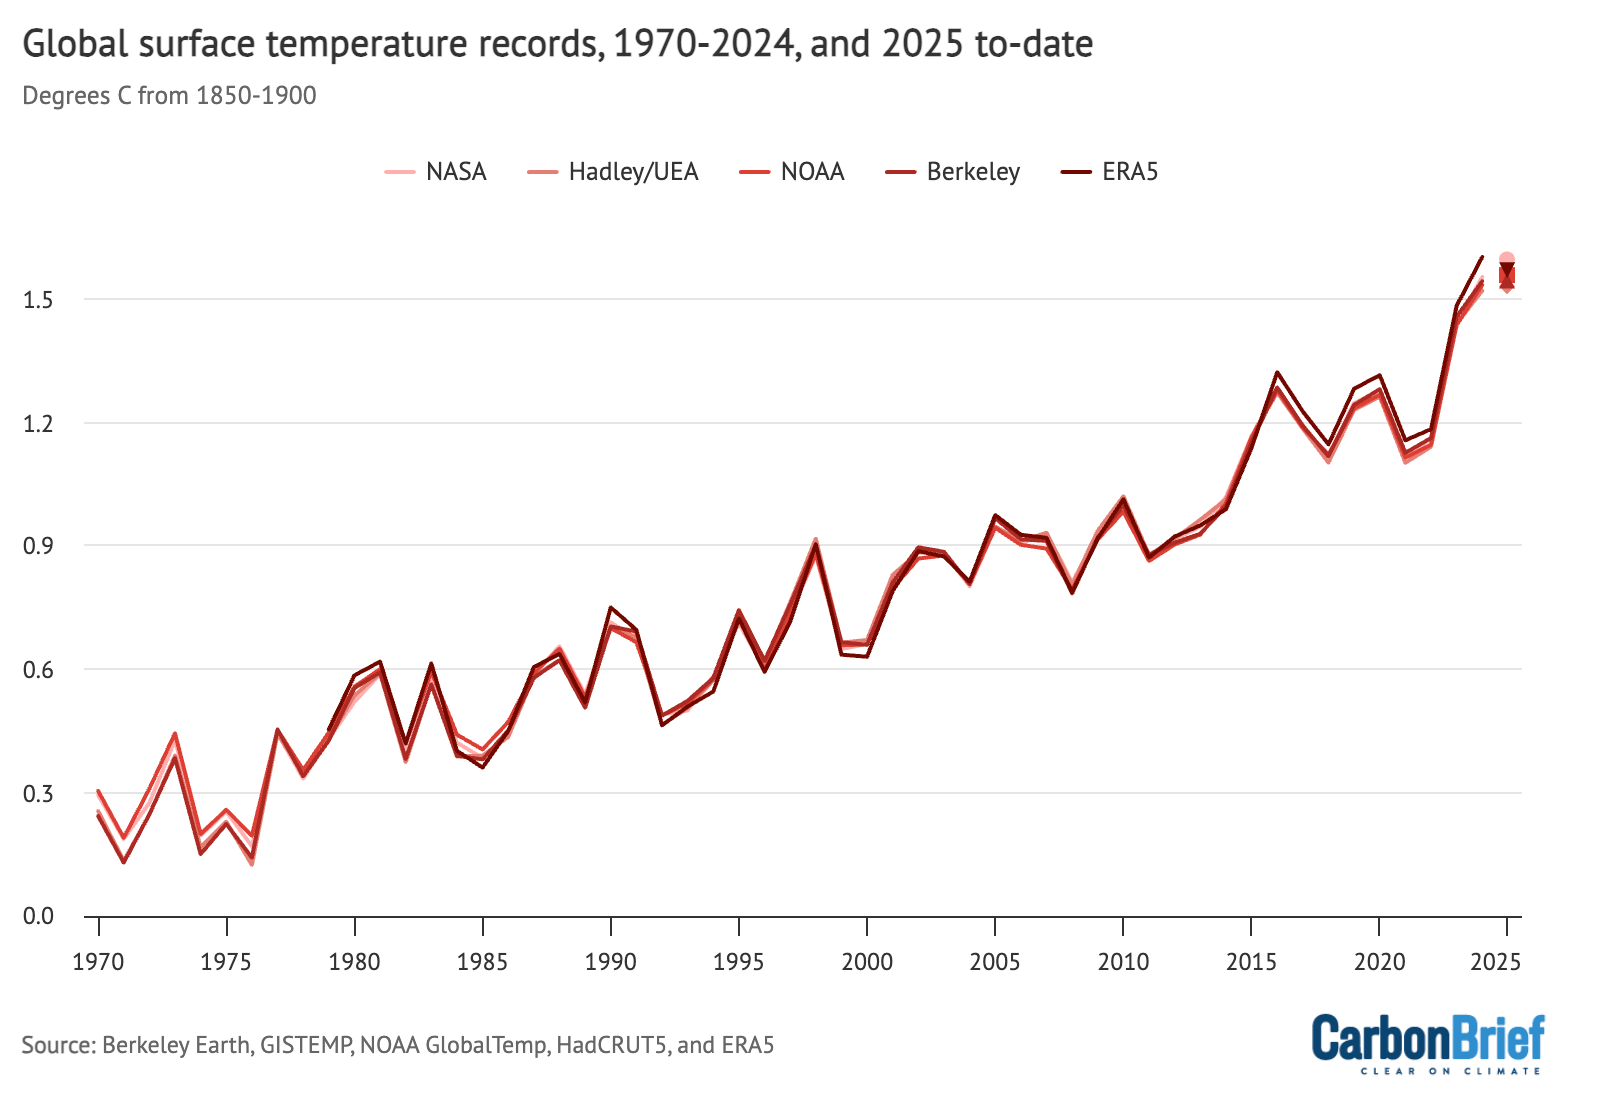
As you can see, the readings were already above the 1.5º threshold in 2024, but I guess we haven’t officially breached that threshold until average temperatures stay that high for a few years. Obviously, average temperatures haven’t gone up every year, but the trend is clear. Do you have any reason to believe the snake on the graph is going to head in the other direction?
So, I think the vast majority of us can agree that the planet is warming. But why? I have another graph that may give you a hint.
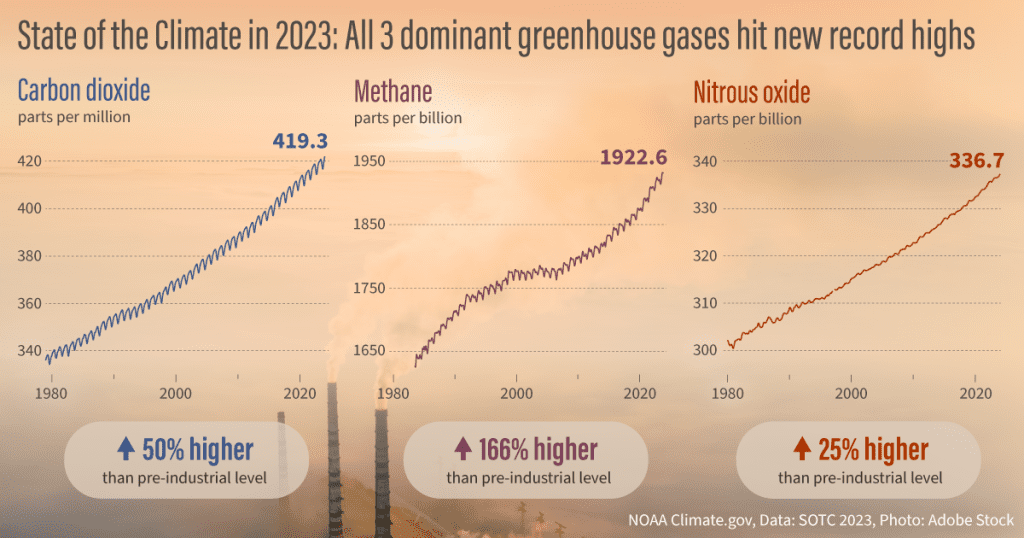
This graph shows how over roughly the same period of time the levels of heat-trapping greenhouse gases in the atmosphere increased. Notice the similar path of these lines to the warming line on the prior graph? Carbon dioxide, methane, and nitrous oxide are gases that humans have been excessively adding to the atmosphere during this time period. How do we know that?
Here’s a graph showing human carbon dioxide emissions since 1750 (the grey line) and the concentration of carbon dioxide in the atmosphere (the blue line). The Earth’s natural carbon cycle is unable to keep up with the amount of carbon dioxide we’re adding, so the excess gets stuck in the atmosphere.
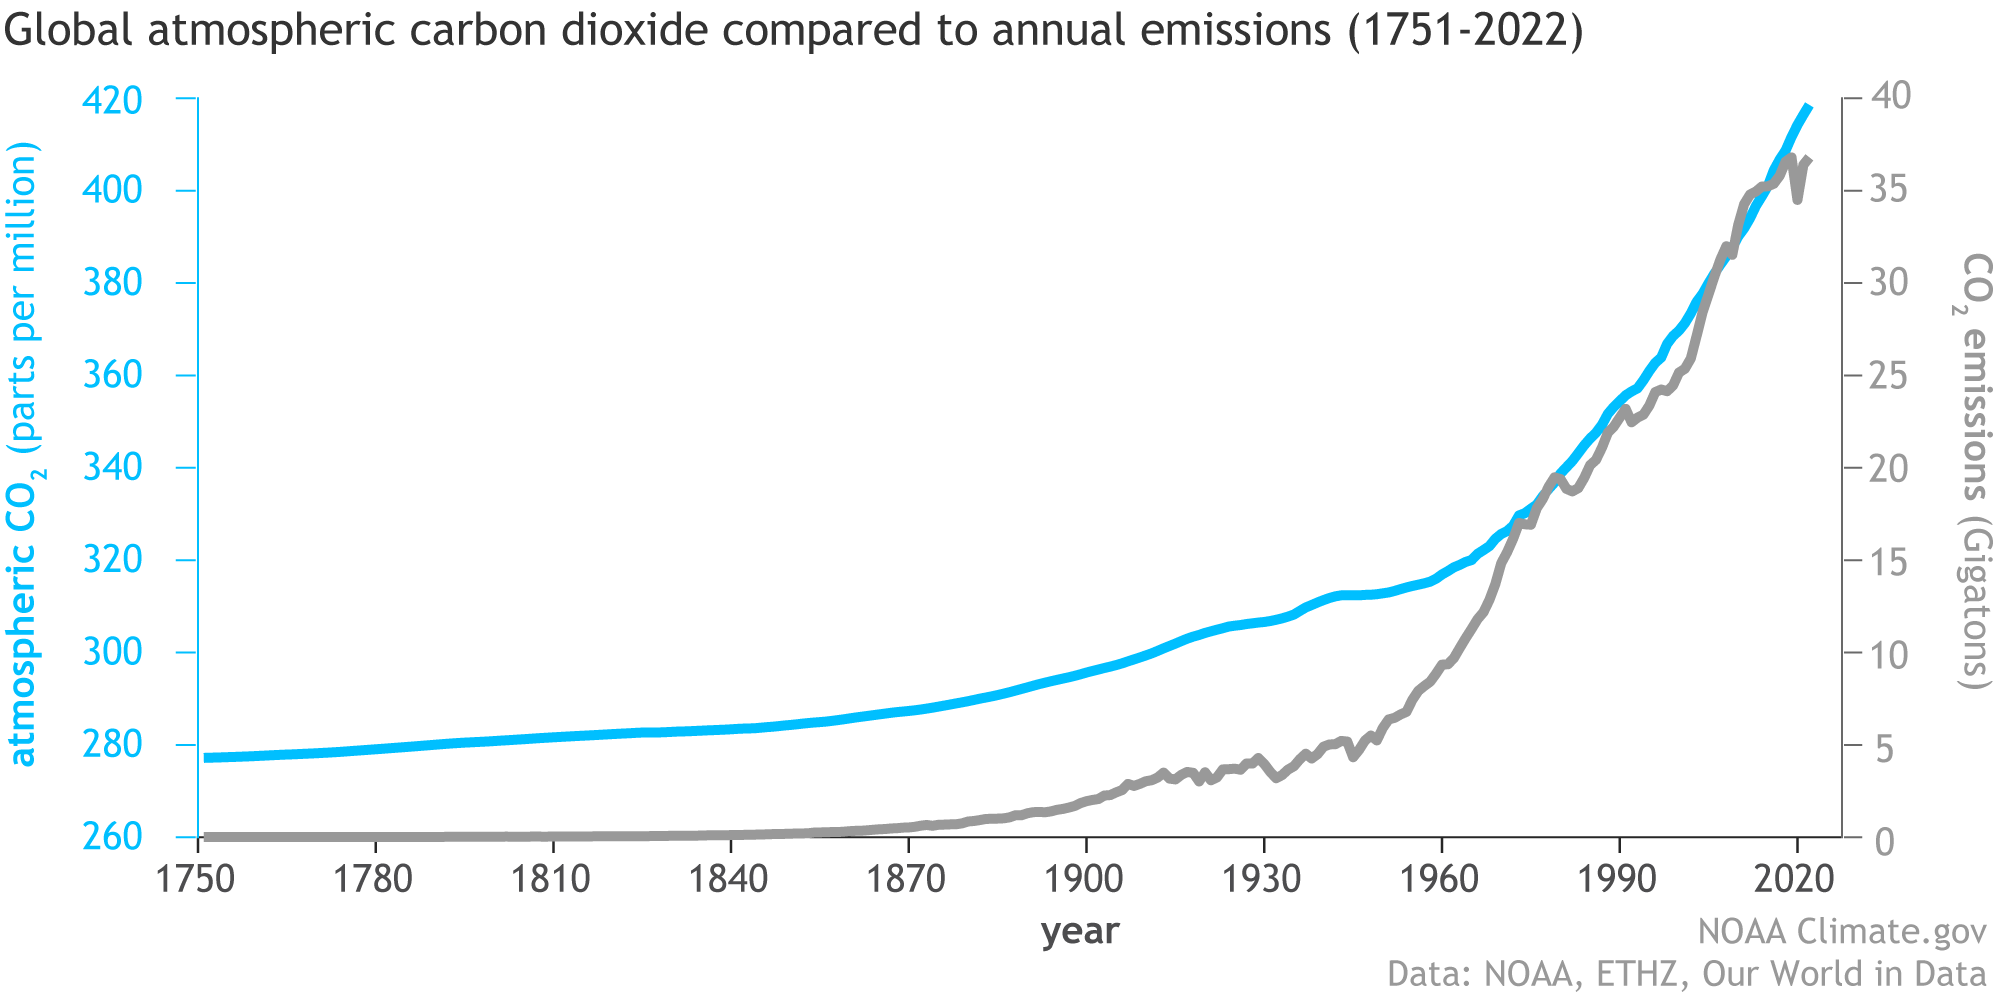
What happened in the mid-1800s that started the upward trend? The industrial revolution. What has happened since the mid-1900s to accelerate the trend? More cars, more airplanes, more industrial agriculture, more construction, etc., all of which generate more greenhouse gas emissions. (The focus here is on carbon dioxide since it has the greatest long-term impact, but other heat-trapping gases are also getting stuck in the atmosphere.) The relationship between increasing carbon dioxide and increasing temperatures wouldn’t come as a surprise to Eunice Newton Foote, the scientist who first demonstrated the greenhouse effect of carbon dioxide in 1856. (I’m waiting for the blockbuster movie of Eunice’s story. Meanwhile, here’s a short film about her.)
You may wonder about earth temperature patterns over the millennia – haven’t there been previous periods of extreme heat or cold? Yes, there have, and here is what that graph looks like.
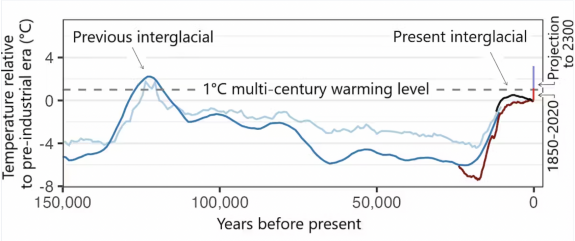
Credit: D.S. Kaufman and N.P. McKay
This graph from Darrell Kaufman , professor at Northern Arizona University, shows Earth temperatures for the past 150,000 years (most of human history) relative to the pre-industrial era. As you can see, for most of that period the temperature was cooler than it is now. The last “interglacial” period (warm temperatures lasting thousands of years) occurred between 130,000 and 116,000 years ago. But things were quite different then. Primarily, there were probably fewer than a million humans on Earth at that time, compared to more than 8 billion today, so, a lot fewer mouths to feed, more room to roam, and a lot less stress by humans on other species. (Fun fact – during this period, it’s estimated that sea level probably rose to 20-30 feet higher than it is today. That’s concerning). The other big difference between that warming episode and the current one is how quickly temperatures are rising now compared to then. Check the slope of the line – the last interglacial warming happened gradually over tens of thousands of years, giving plants, animals, and humans time to adapt and to migrate. The current warming is happening exponentially faster. Notice that the red part of the line, showing the approximate 1.4º C temperature increase in the last 170 years, goes almost straight up.
Looking at all these graphs, can you imagine any of the lines turning around and heading down in our lifetimes? Clearly we are about to blow past the 1.5º C safe threshold the experts warned about. Now you, too, can say, “Tell me something I don’t know.”
What we don’t know is how bad it’s going to get. A certain amount of continued warming is built-in. There are feedback loops that may continue to amplify warming (see excellent videos about warming feedback loops here). But we all make decisions every day that push the scales one way or another. The products we buy, the ways we travel, the food we eat, and the leaders we vote for all make a difference. We can choose to fight climate change or we can just watch things get worse for ourselves and future generations.
Now that you know what’s happening, how can you ignore it? I encourage you to find ways to make a difference. Here are some great resources to guide you on your journey:
Dr. Ayana E. Johnson’s Venn Diagram (check out the linked Ted Talk!)
Dr. Kimberly Nicholas’ “Find My Superpowers” and other resources on SHIFT
Dr. Katharine Wilkinson’s Climate Wayfinding book and interactive guide for group discussions
Dr. Katharine Hayhoe’s Talking Climate Substack and newsletter
Project Drawdown’s Drawdown Explorer
All of the amazing scientists linked above have books, articles, videos, podcasts, and newsletters to help us understand what’s going on and to support us in bringing others along. The solutions are out there. But no one can do it alone. We’re all in this together.
Next week, it’s back to people making a difference.