
Making a Difference Through Art
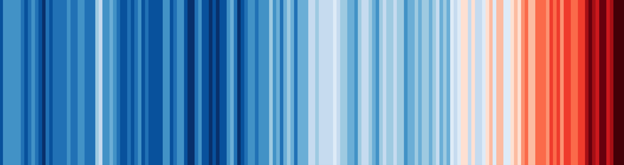
Climate Stripes
One of the cool things about raising kids is the way it can help you understand how different our brains work. If you raise more than one kid (or teach lots of kids), you soon realize that what’s going on inside each head can be very different. We don’t enter the world as the “tabula rasa,” the clean slate waiting to be filled. Not only do we have our innate likes and dislikes, strengths and weaknesses, and personal inclinations, we also naturally process information differently.
My brain is primarily a words-and-logic brain (which also does some numbers, music, and physical stuff on the side). Some of my friends have music brains, athlete brains, number brains, visual arts brains, storytelling brains, or combinations of those, or have altogether other ways of processing the world around them.
Those who process the world in a more visual way fascinate me. They see things that I don’t see. They creatively translate those perceptions into new visions or explanations of what is or what could be. They expand my understanding of everything. Today I’ll tell you about people who are translating climate impact data into visual arts.

Climate Stripes with Labels
The two images above are known as “Climate Stripes.” They represent the global average temperature difference each year relative to the average temperature of 1961-2010, using various colors to represent those changes (blue is cooler and red is warmer than that average). It is scientific data translated into a colorful, resonant visual by a climate scientist with an appreciation for images named Ed Hawkins. But we’ll get back to him – first let’s explore the “humble origins” of the Climate Stripes.
It started with another climate scientist (and crochet artist), Ellie Highwood, and her quest for the perfect baby gift. Highwood wanted to give something that was appropriate and also meaningful. The artistic, visionary part of her brain came up with an idea for a crocheted “global warming blanket.” Below is a photo of that blanket - it is 100 rows of crochet, using different colors to represent global average temperature variations during the 100 years ending in the baby’s birth year. Once the blanket was done, Highwood posted a picture of it on social media, and it went viral! (Other like-minded visionaries had created similar designs, but this is the one that led to Climate Stripes.)
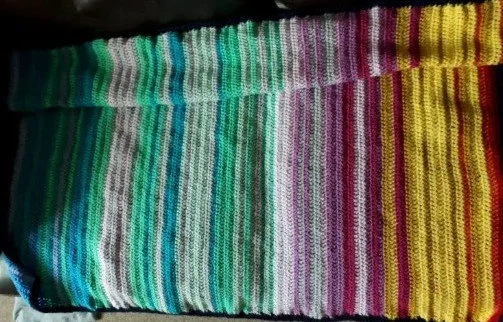
Global Warming Blanket
At that time, Highwood was a Professor of Climate Change at the University of Reading where Ed Hawkins joined the staff the next year. Hawkins was well aware of the global warming blanket, and in 2018, he took the concept in a new direction and created ShowYourStripes, a site where anyone can create colored climate graphs for locations all over the world based on scientific data, learn more about the data, and get involved in Show Your Stripes Day each June. Here are the stripes for Washington, DC, the nearest large city to my home:
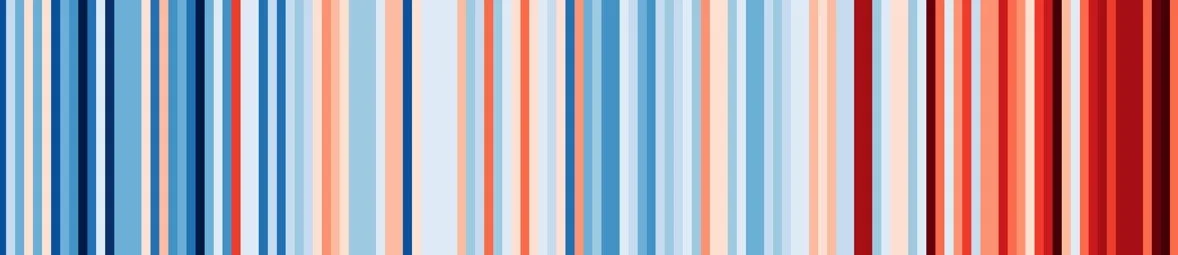
DC Climate Stripes
For visual brains (and other brains), these stripes make the problem very clear in a way that other graphs may not.
One of the more interesting twists in this story is that other creatives were inspired by Show Your Stripes to turn it back into fiber-based visual art! The Tempestry Project is a community of “friends, artists, crafters, teachers, scientists, activists, nature lovers, and more” who collaborate using fiber art to explore and communicate temperature data. Founded by Emily McNeil, Asy Connelly, and Marissa Connelly, their New Normal Tempestries are pre-packaged knit and crochet projects inspired by Professor Hawkins’ Warming Stripes. There’s even a “workshop in a box” for 30 participants to create mini Tempestries for a particular state! Also, multiple communities have engaged in collaborations with the Tempestry Project to bring together local fiber artists to create wall-hangings depicting temperature change in their regions.
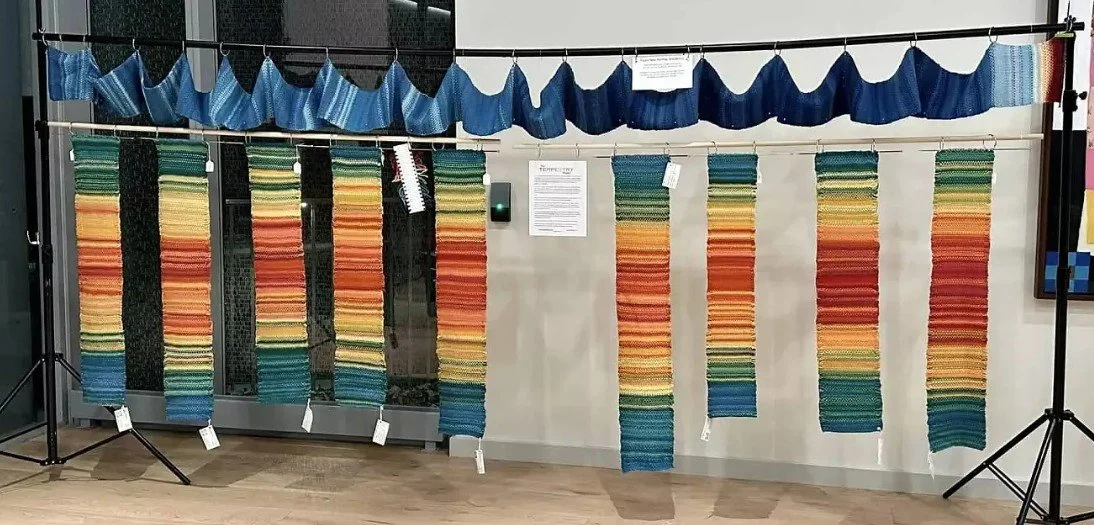
Mid-Hudson Valley Library System - Chronogram.com
But the story doesn’t end there. After discovering the Tempestry Project and creating a couple of them herself, writer, environmentalist, and fiber artist Erika Zambello started dreaming of a project to create Tempestries showing temperature change at the National Parks that had shaped her outlook on the natural world. By the spring of 2019, Zambello had teamed up with the Tempestry Project to make her vision a reality. The amazing story of that project can be found on the National Parks Conservation Association’s website as “A Stitch in Time.” The project recruited crafters to create two Tempestries for their chosen park, one from 2016 and one from a year in the past (maybe 50 or 100 years prior), each showing the local climate data over the course of that year. The two works were then displayed side by side, showing how things had changed over that time period. Each completed pair has been photographed in its National Park setting, providing an even more powerful visual impact.
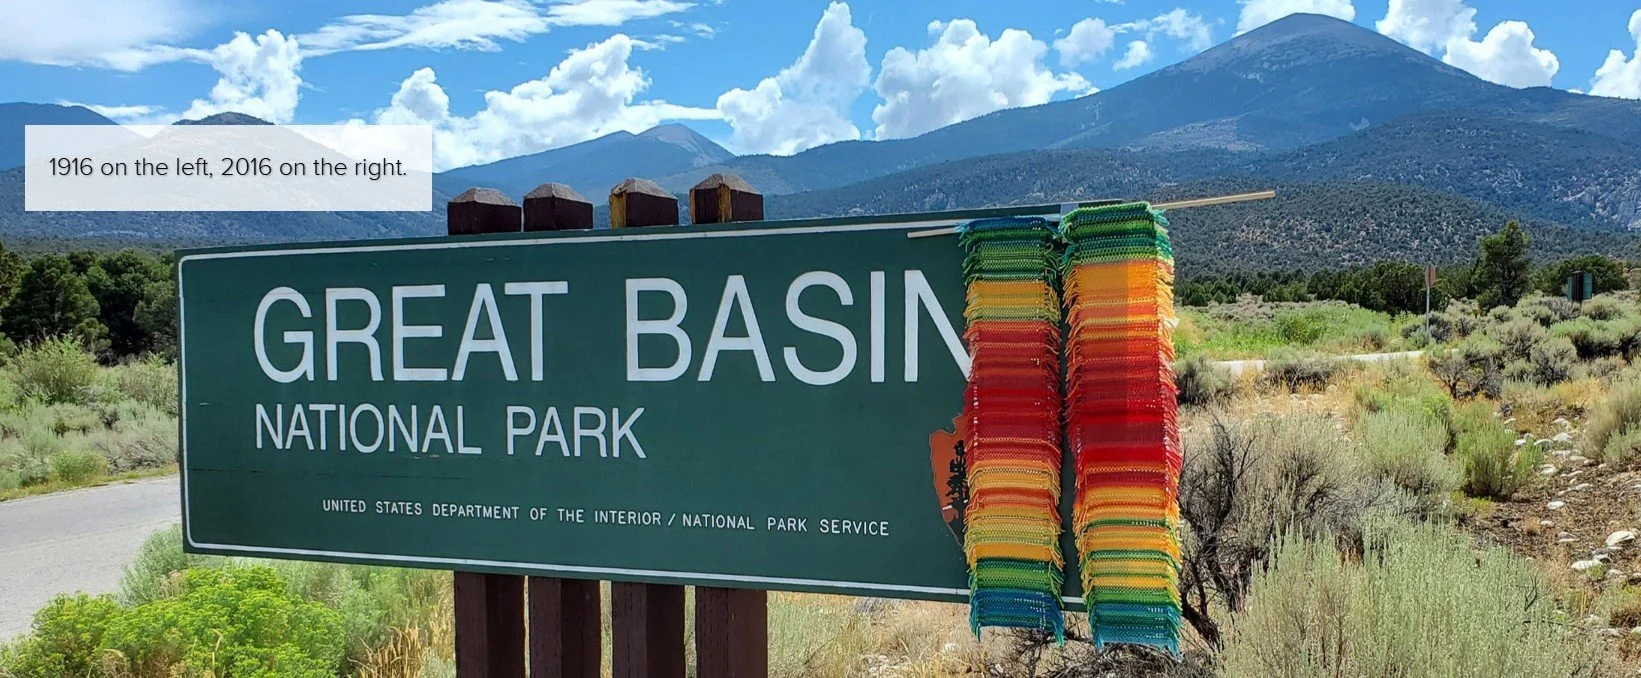
Credit: https://express.adobe.com/page/SynDUSs9izWdc/, Crafted by Lisa Waterman
Although these works of art are only snapshots in time and can’t tell the whole story of climate change, they are a compelling way to draw people in and begin telling the story.
I mentioned earlier that other crafters and artists were doing similar projects to Ellie Highwood’s even before the global warming blanket went viral. One of those artists was Joan Sheldon of Sheldon Fiber Designs. In 2015, she created the Globally Warm Scarf design, using shades of blue, purple, and red to depict climate variation from normal temperatures since 1600 in a crocheted scarf. A wonderful post on Sheldon’s website tells the story of the design and includes a link to download the FREE pattern. I love this scarf, and I especially love the fact that she updated the pattern with the latest data last year.
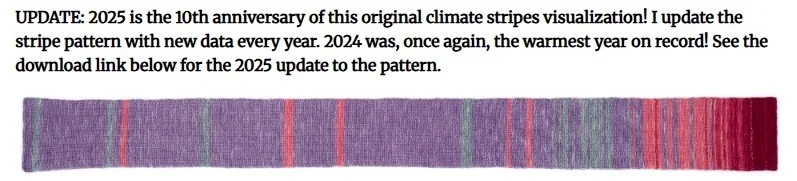
Joan Sheldon’s Globally Warm Scarf
If you are a fiber artist, you can now find hundreds of patterns online for blankets, scarves, and wall hangings portraying temperature change. Or maybe you’ve been inspired to create your own visual art to help communicate the urgency of climate change! Keeping our planet thriving requires more than scientists, engineers, and data crunchers. We need everyone’s brains, skills, and talents.
We’re all in this together, and we need all of us to fix it.
Resources: showyourstripes.info, research.reading.ac.uk, edhawkins.org, theworld.org, elliehighwood.com, tempestryproject.com, chronogram.com, npca.org, express.adobe.com, sheldonfiberdesigns.net, audubon.org,