
The Water Problem
Cormorants on the river
It’s been a cold, snowy, icy winter here in the eastern US. That might get some folks thinking that the climate situation is improving – maybe we’re not warming and drying after all. But don’t let the regional weather fool you – the reality of climate change is unfolding fast in the western US. And whether you’re concerned about the impacts on the natural world or on the economy and businesses, the news is not good.
I spent a few days in Phoenix this week, and everyone kept telling me that it was unseasonably warm, even for Phoenix. Sure enough, while I was there, Phoenix set a new high temperature record of 93 degrees on March 2. Yikes. Arizona, like much of the Mountain West, has had a very dry winter– minimal snow in mountains, which will lead to low water levels in rivers and streams in the spring. Water managers across the west are working hard to figure out how to reduce the impact of drought conditions affecting the Colorado River and other rivers supplying the state, now and in the future. But what struck me in metro-Phoenix was how many yards have grass that can only be kept alive by constant watering! I don’t get it. The desert’s native plants are amazing and beautiful – why force non-native species to live there?
Water management is a local issue, but it depends on and affects other areas within the same watershed. Every region has different levels of water supply and demand that must be managed in coordination with other regions. So how do you know if you need to take action? First, determine if you live in a water-stressed region (or in the same watershed as water-stressed regions). If so, do whatever you can to limit your water use. Even if your area is not water-stressed, it still makes sense not to waste water and the energy required to pump it to your house.
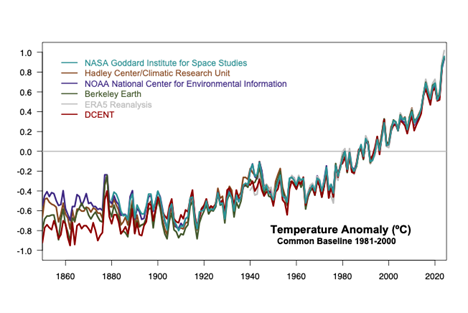
It’s also important to understand how we got into this predicament and learn how we can work together to get out of it. The two graphs below show how global temperatures have risen at an unprecedented rate in the past century, leading to extreme droughts and other extreme weather conditions. The first one shows average global temperatures compared to the averages between 1981 and 2000 (the period where the lines cross the 0.0 line). Average temperatures prior to that time were below and temperatures since then have been above those averages. Note that they generally started trending upward in the early 1900s. The next graph shows the global carbon dioxide emissions along with the carbon dioxide levels in the atmosphere, which follow the same general curve as the warming curve. This is not a coincidence. There have been hundreds of scientific studies demonstrating how carbon dioxide (and other “greenhouse gases”) trap heat from the sun that warms our planet, starting with a demonstration by Eunice Newton Foote in 1856. This heat-trapping is what allows for life to exist on the Earth, but too much heat is a danger to most life, including ours.
What was the primary cause of the acceleration of greenhouse gases into the atmosphere? The Industrial Revolution. Prior to 1850 (the beginning of the inflection on the carbon dioxide graph), humans weren’t burning the tons of fossil fuels that we have been burning ever since. The effect of using more and more fossil fuels (gasoline, diesel, natural gas, coal, etc.) is cumulative – that is, these gases remain in the atmosphere for hundreds or even thousands of years. Yes, plants take in carbon dioxide in their life processes, but not fast enough to keep up with the amount we’re putting into the air. So, the concentration of carbon dioxide and other greenhouse gases just continues to grow, trapping more and more heat near the earth.

What can you do to help reduce this trend?
Learn about and support clean energy efforts in your community and state
Support candidates who acknowledge human impact on the environment and promise to work to reduce emissions
Support businesses that are working to reduce their emissions
Let businesses know that you want them to reduce emissions
Learn about and support sustainable banking
Evaluate all of the ways your activities use fossil fuels and reduce your emissions
Shop responsibly and locally (and buy less stuff!)
Remember, we’re all in this together!